K-means 알고리즘 프로젝트
[공지사항] 민혁 블로그 신규 포스팅 안내 드립니다.
[영상처리] K-평균 알고리즘 구현
< K-means clustering algorithm >
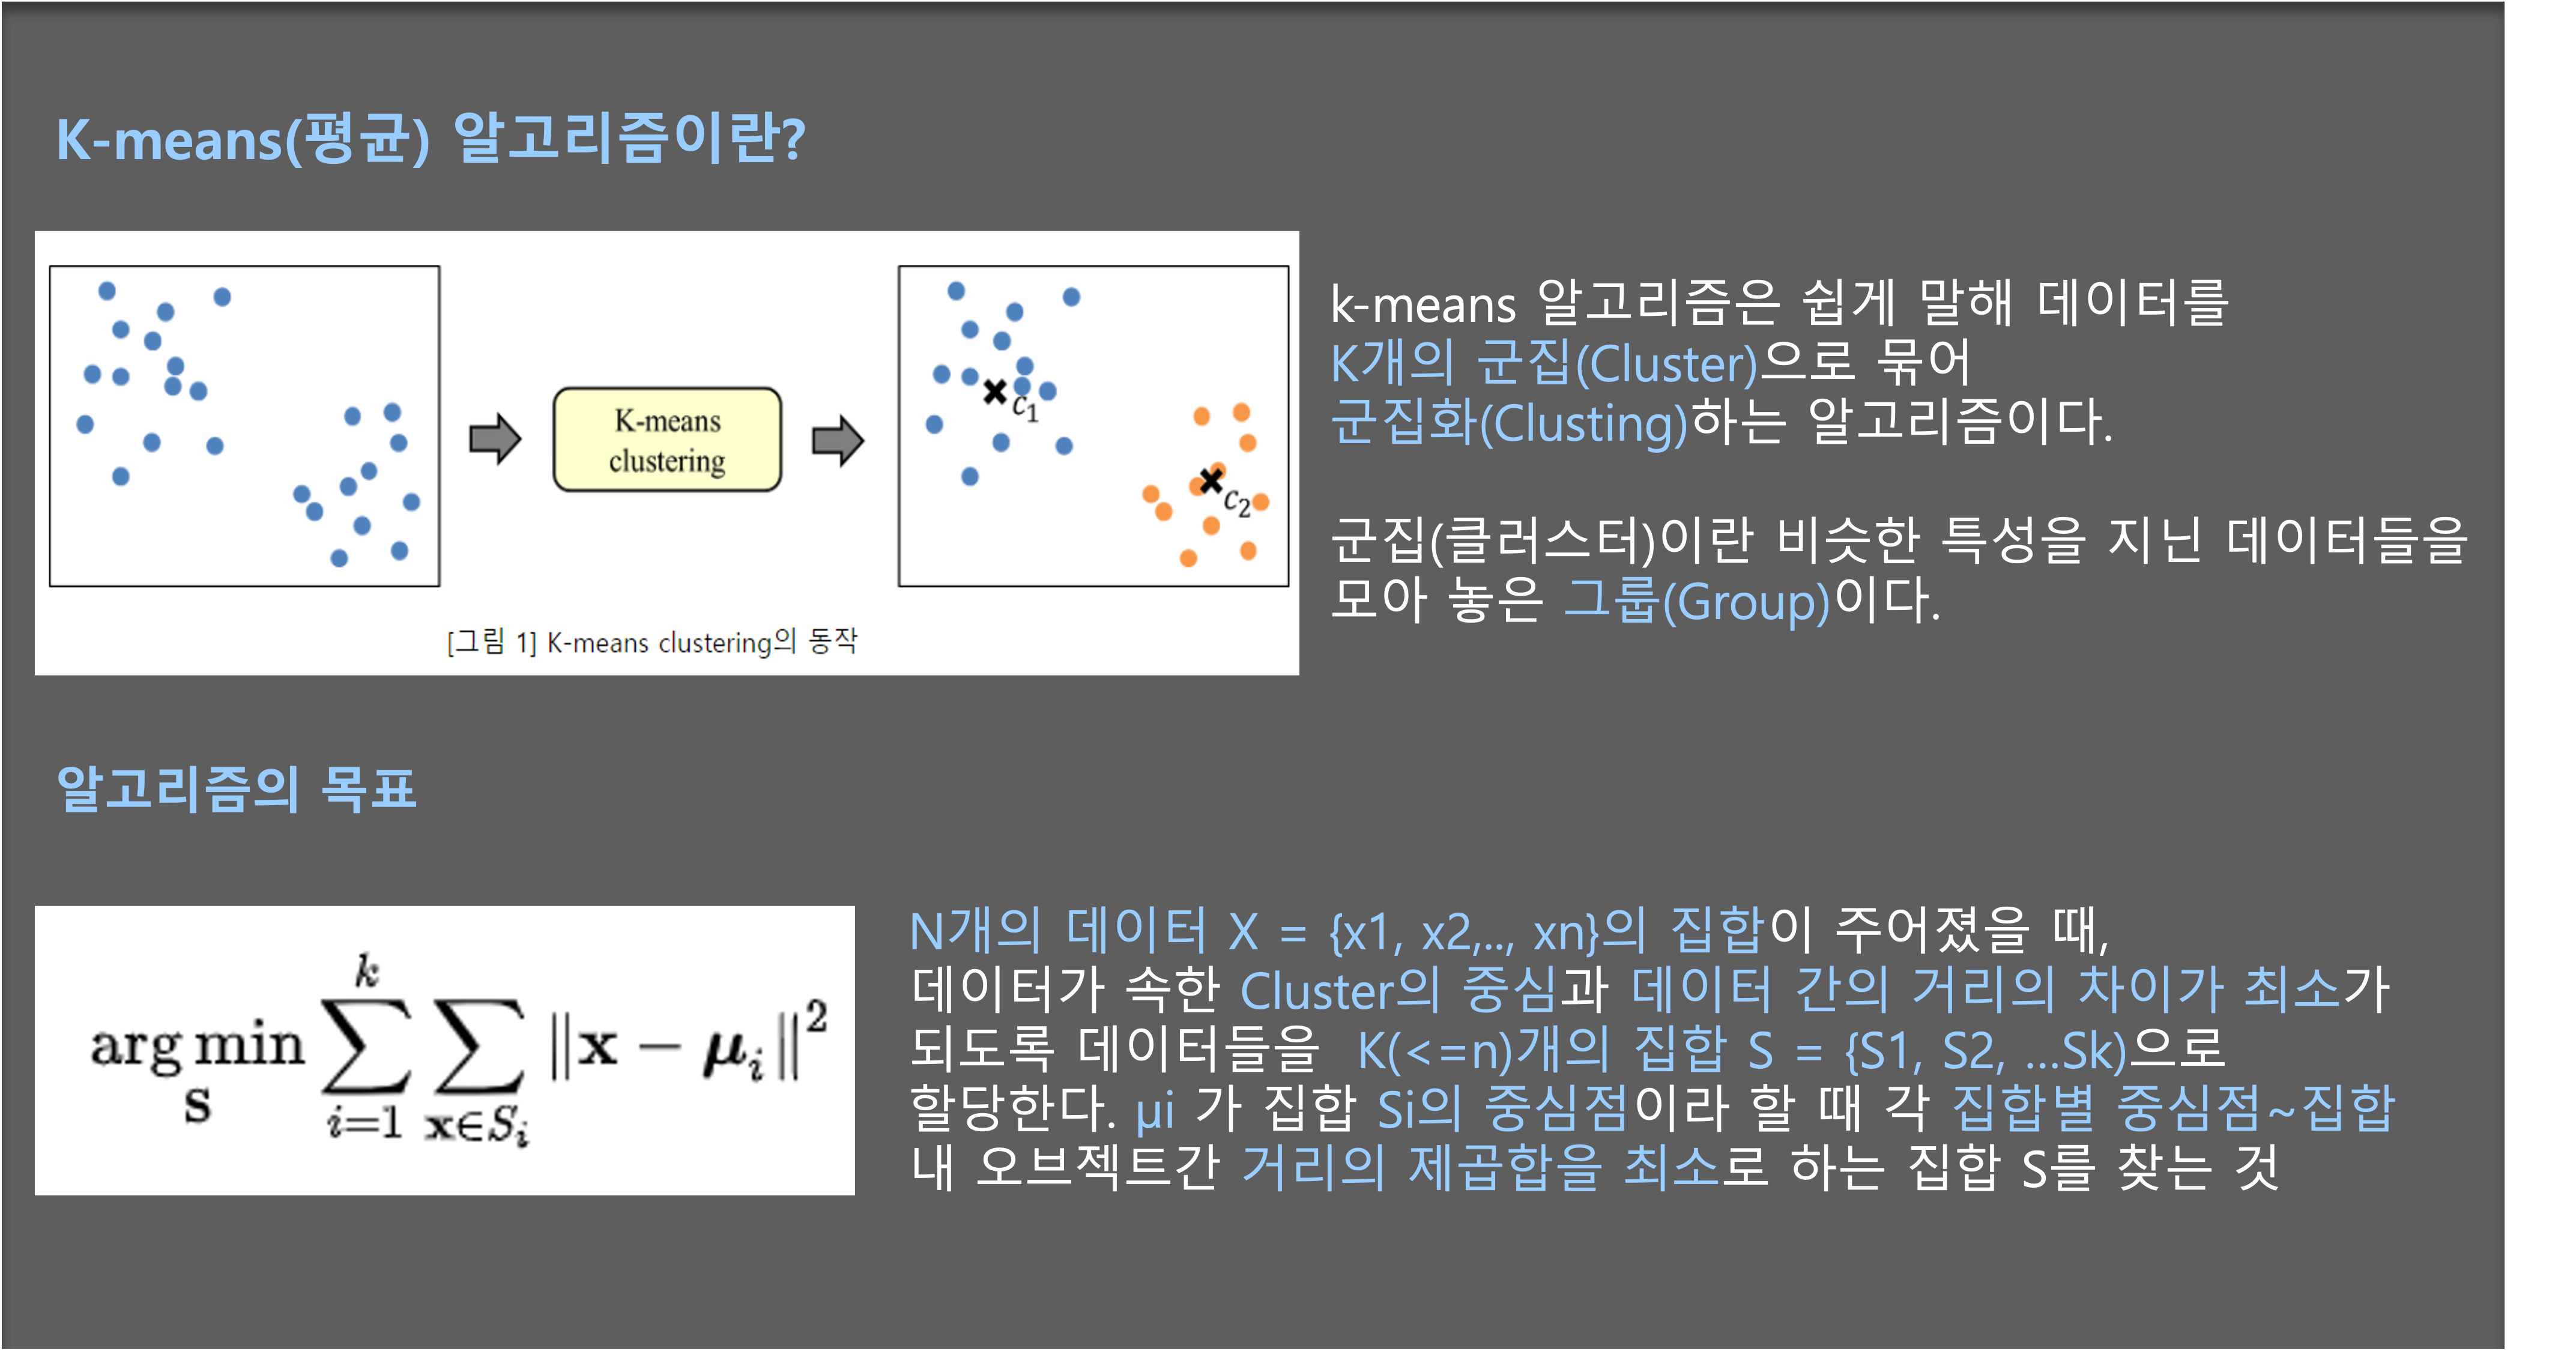
K-means clustering 알고리즘이란?
코드 구현 순서
- 클러스터의 개수(K) 값 설정
- K-means 클러스팅을 무작위로 초기 중심점 선택 (무작위 분할)
- 각 데이터 포인트를 가장 가까운 중심점에 할당
- 할당된 클러스터의 평균으로 중심점 업데이트
- K-means 클러스터링 알고리즘을 수행
    import numpy as np
    import matplotlib.pyplot as plt

    # 클러스터 개수(K) 설정
    k = 7

    def initialize_centroids(points, k):
        # 무작위로 초기 중심점 선택
        centroids_indices = np.random.choice(len(points), k, replace=False)
        centroids = points[centroids_indices]
        return centroids

    def assign_datapoint_clusters(points, centroids):
        # 각 데이터 포인트를 가장 가까운 중심점에 할당
        distances = np.sqrt(((points - centroids[:, np.newaxis])**2).sum(axis=2))
        cluster_index = np.argmin(distances, axis=0)
        return cluster_index

    def update_centroids(points, cluster_index, k):
        # 할당된 클러스터의 평균으로 중심점 업데이트
        centroids = np.zeros((k, points.shape[1]))
        for i in range(k):
            cluster_points = points[cluster_index == i]
            if len(cluster_points) > 0:
                centroids[i] = np.mean(cluster_points, axis=0)
        return centroids

    def k_means(points, k, max_iterations=100):
        centroids = initialize_centroids(points, k)
        for _ in range(max_iterations):
            cluster_index = assign_datapoint_clusters(points, centroids)
            new_centroids = update_centroids(points, cluster_index, k)
            if np.all(centroids == new_centroids):
                break
            centroids = new_centroids
        return centroids, cluster_index

    def image_segmentation(image, k):
        # 이미지를 1차원 배열로 변환
        h, w, c = image.shape
        points = image.reshape(h * w, -1)

        # k-means 알고리즘을 통해 클러스터 중심점 찾기
        centroids, cluster_index = k_means(points, k)

        # 클러스터 중심점으로 이미지 재구성
        segmented_image = centroids[cluster_index].reshape(h, w, -1).astype(np.uint8)
        return segmented_image

    # 이미지 로드
    image_path = '/content/pets.jpg'
    image = plt.imread(image_path)

    # 결과 시각화
    num_cols = 4  # 한 행에 표시할 이미지 개수
    num_rows = (k + num_cols - 1) // num_cols  # 총 행 개수

    fig, axes = plt.subplots(num_rows, num_cols, figsize=(15, 5))

    # 원본 이미지 표시
    axes[0, 0].imshow(image)
    axes[0, 0].set_title('Original Image')

    for i in range(k):
        # 이미지 분할
        segmented_image = image_segmentation(image, k=i+1)

        # 분할된 이미지 표시
        row = (i + 1) // num_cols
        col = (i + 1) % num_cols

        axes[row, col].imshow(segmented_image)
        axes[row, col].set_title('Segmented Image (k={})'.format(i+1))

    # 빈 축 숨기기
    if k < num_rows * num_cols:
        for i in range(k + 1, num_rows * num_cols):
            row = i // num_cols
            col = i % num_cols
            axes[row, col].axis('off')

    plt.tight_layout()
    plt.show()
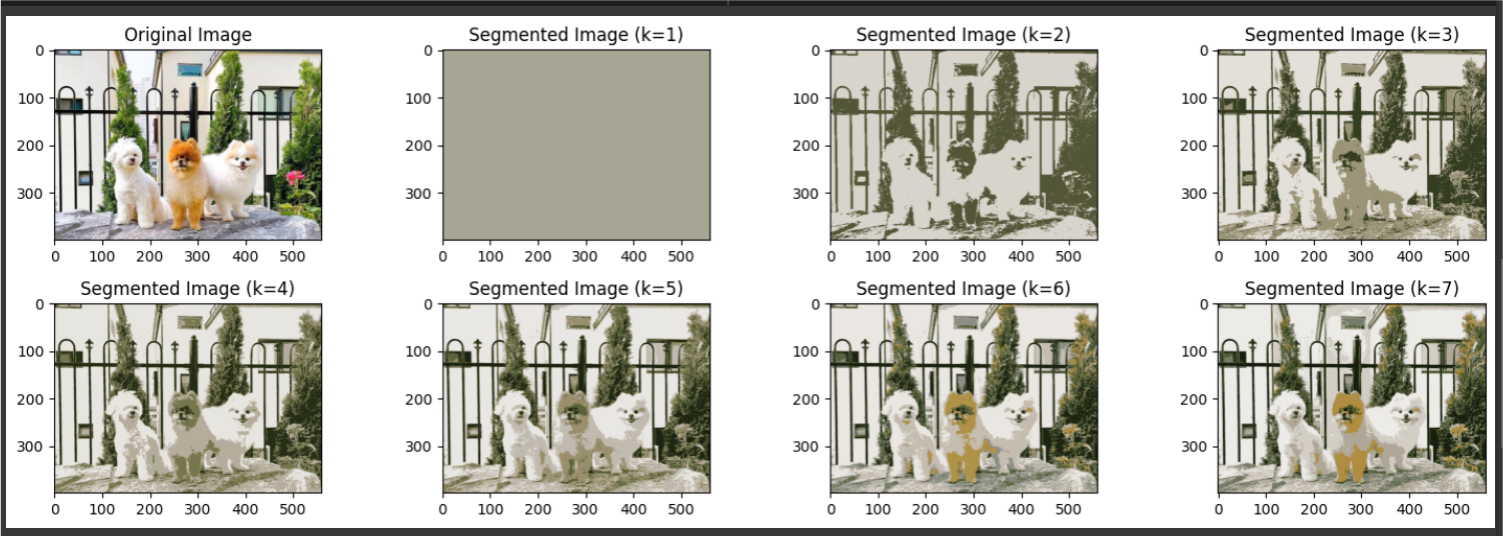
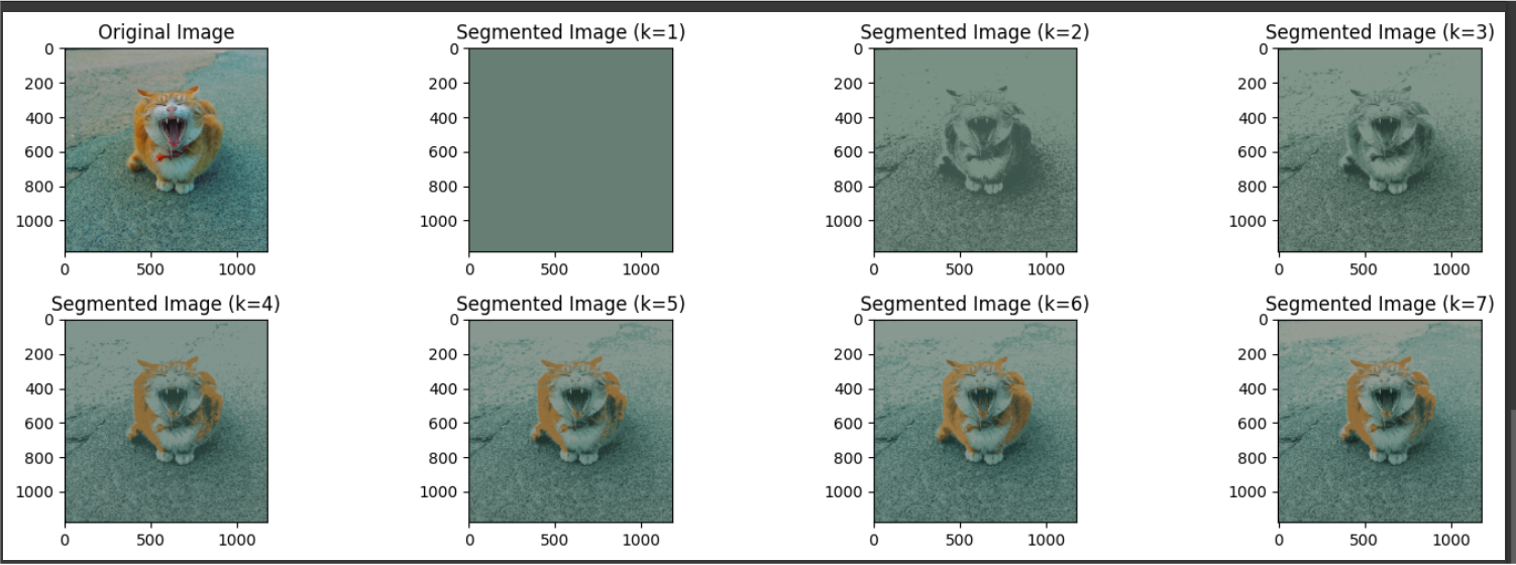
구현 결과
댓글남기기