히스토그램 평활화 프로젝트
[공지사항] 민혁 블로그 신규 포스팅 안내 드립니다.
[영상처리] 컬러 영상 히스토그램 평활화 구현
< Histogram equalization >
코드 구현 순서
- 평활화를 진행할 이미지를 로드합니다.
- 이미지를 RGB 채널별로 분리합니다.
- 각 채널별로 히스토그램을 계산합니다.
- 각 채널별로 누적 히스토그램을 계산합니다.
- 히스토그램 평활화 수식을 적용합니다.
- 각 채널별로 생성된 이미지를 합쳐 최종 이미지를 생성합니다.
    import numpy as np
    import matplotlib.pyplot as plt
    from PIL import Image

    # 컬러 이미지를 로드하기
    img = np.array(Image.open("/content/skyandbreeze.jpg"))

    # RGB 채널로 각각 분리하여 변수에 저장하기
    R, G, B = img[:,:,0], img[:,:,1], img[:,:,2]

    # 각 채널별로 히스토그램 계산하기
    histo_R, bins = np.histogram(R.flatten(), 256, [0,255])
    histo_G, bins = np.histogram(G.flatten(), 256, [0,255])
    histo_B, bins = np.histogram(B.flatten(), 256, [0,255])

    # 각 채널별로 누적(cdf) 히스토그램 계산하기
    cdf_R = histo_R.cumsum()
    cdf_G = histo_G.cumsum()
    cdf_B = histo_B.cumsum()

    # 히스토그램 평활화 수식 적용하기
    cdf_R = 255 * cdf_R / cdf_R[-1]
    cdf_G = 255 * cdf_G / cdf_G[-1]
    cdf_B = 255 * cdf_B / cdf_B[-1]

    # 각 채널별로 평활화된 이미지 생성하기
    img_R = np.interp(R.flatten(), bins[:-1], cdf_R)
    img_G = np.interp(G.flatten(), bins[:-1], cdf_G)
    img_B = np.interp(B.flatten(), bins[:-1], cdf_B)

    # 생성된 이미지를 RGB 채널로 다시 합쳐 최종 이미지를 생성하기
    img_R = img_R.reshape(R.shape)
    img_G = img_G.reshape(G.shape)
    img_B = img_B.reshape(B.shape)
    img_eq = np.stack((img_R, img_G, img_B), axis=2)
    img_eq = img_eq.astype(np.uint8)

    # subplot 만들기
    fig, axes = plt.subplots(nrows=2, ncols=2, figsize=(10,5))

    # 원본 이미지 출력하기
    axes[0, 0].imshow(img)
    axes[0, 0].set_title('Original Image')

    # 원본 이미지 히스토그램 표시하기
    axes[1, 0].hist(img.ravel(), 256, [0,255], color='gray')
    axes[1, 0].set_title('Original Image Histogram')

    # 평활화된 이미지 표시하기
    axes[0, 1].imshow(img_eq)
    axes[0, 1].set_title('Equalized Image')

    # 평활화된 이미지 히스토그램 표시하기
    axes[1, 1].hist(img_eq.ravel(), 256, [0,255], color='gray')
    axes[1, 1].set_title('Equalized Image Histogram')

    # 전체 subplot 조절하기
    plt.tight_layout()

    # 전체 plot 보여주기
    plt.show()
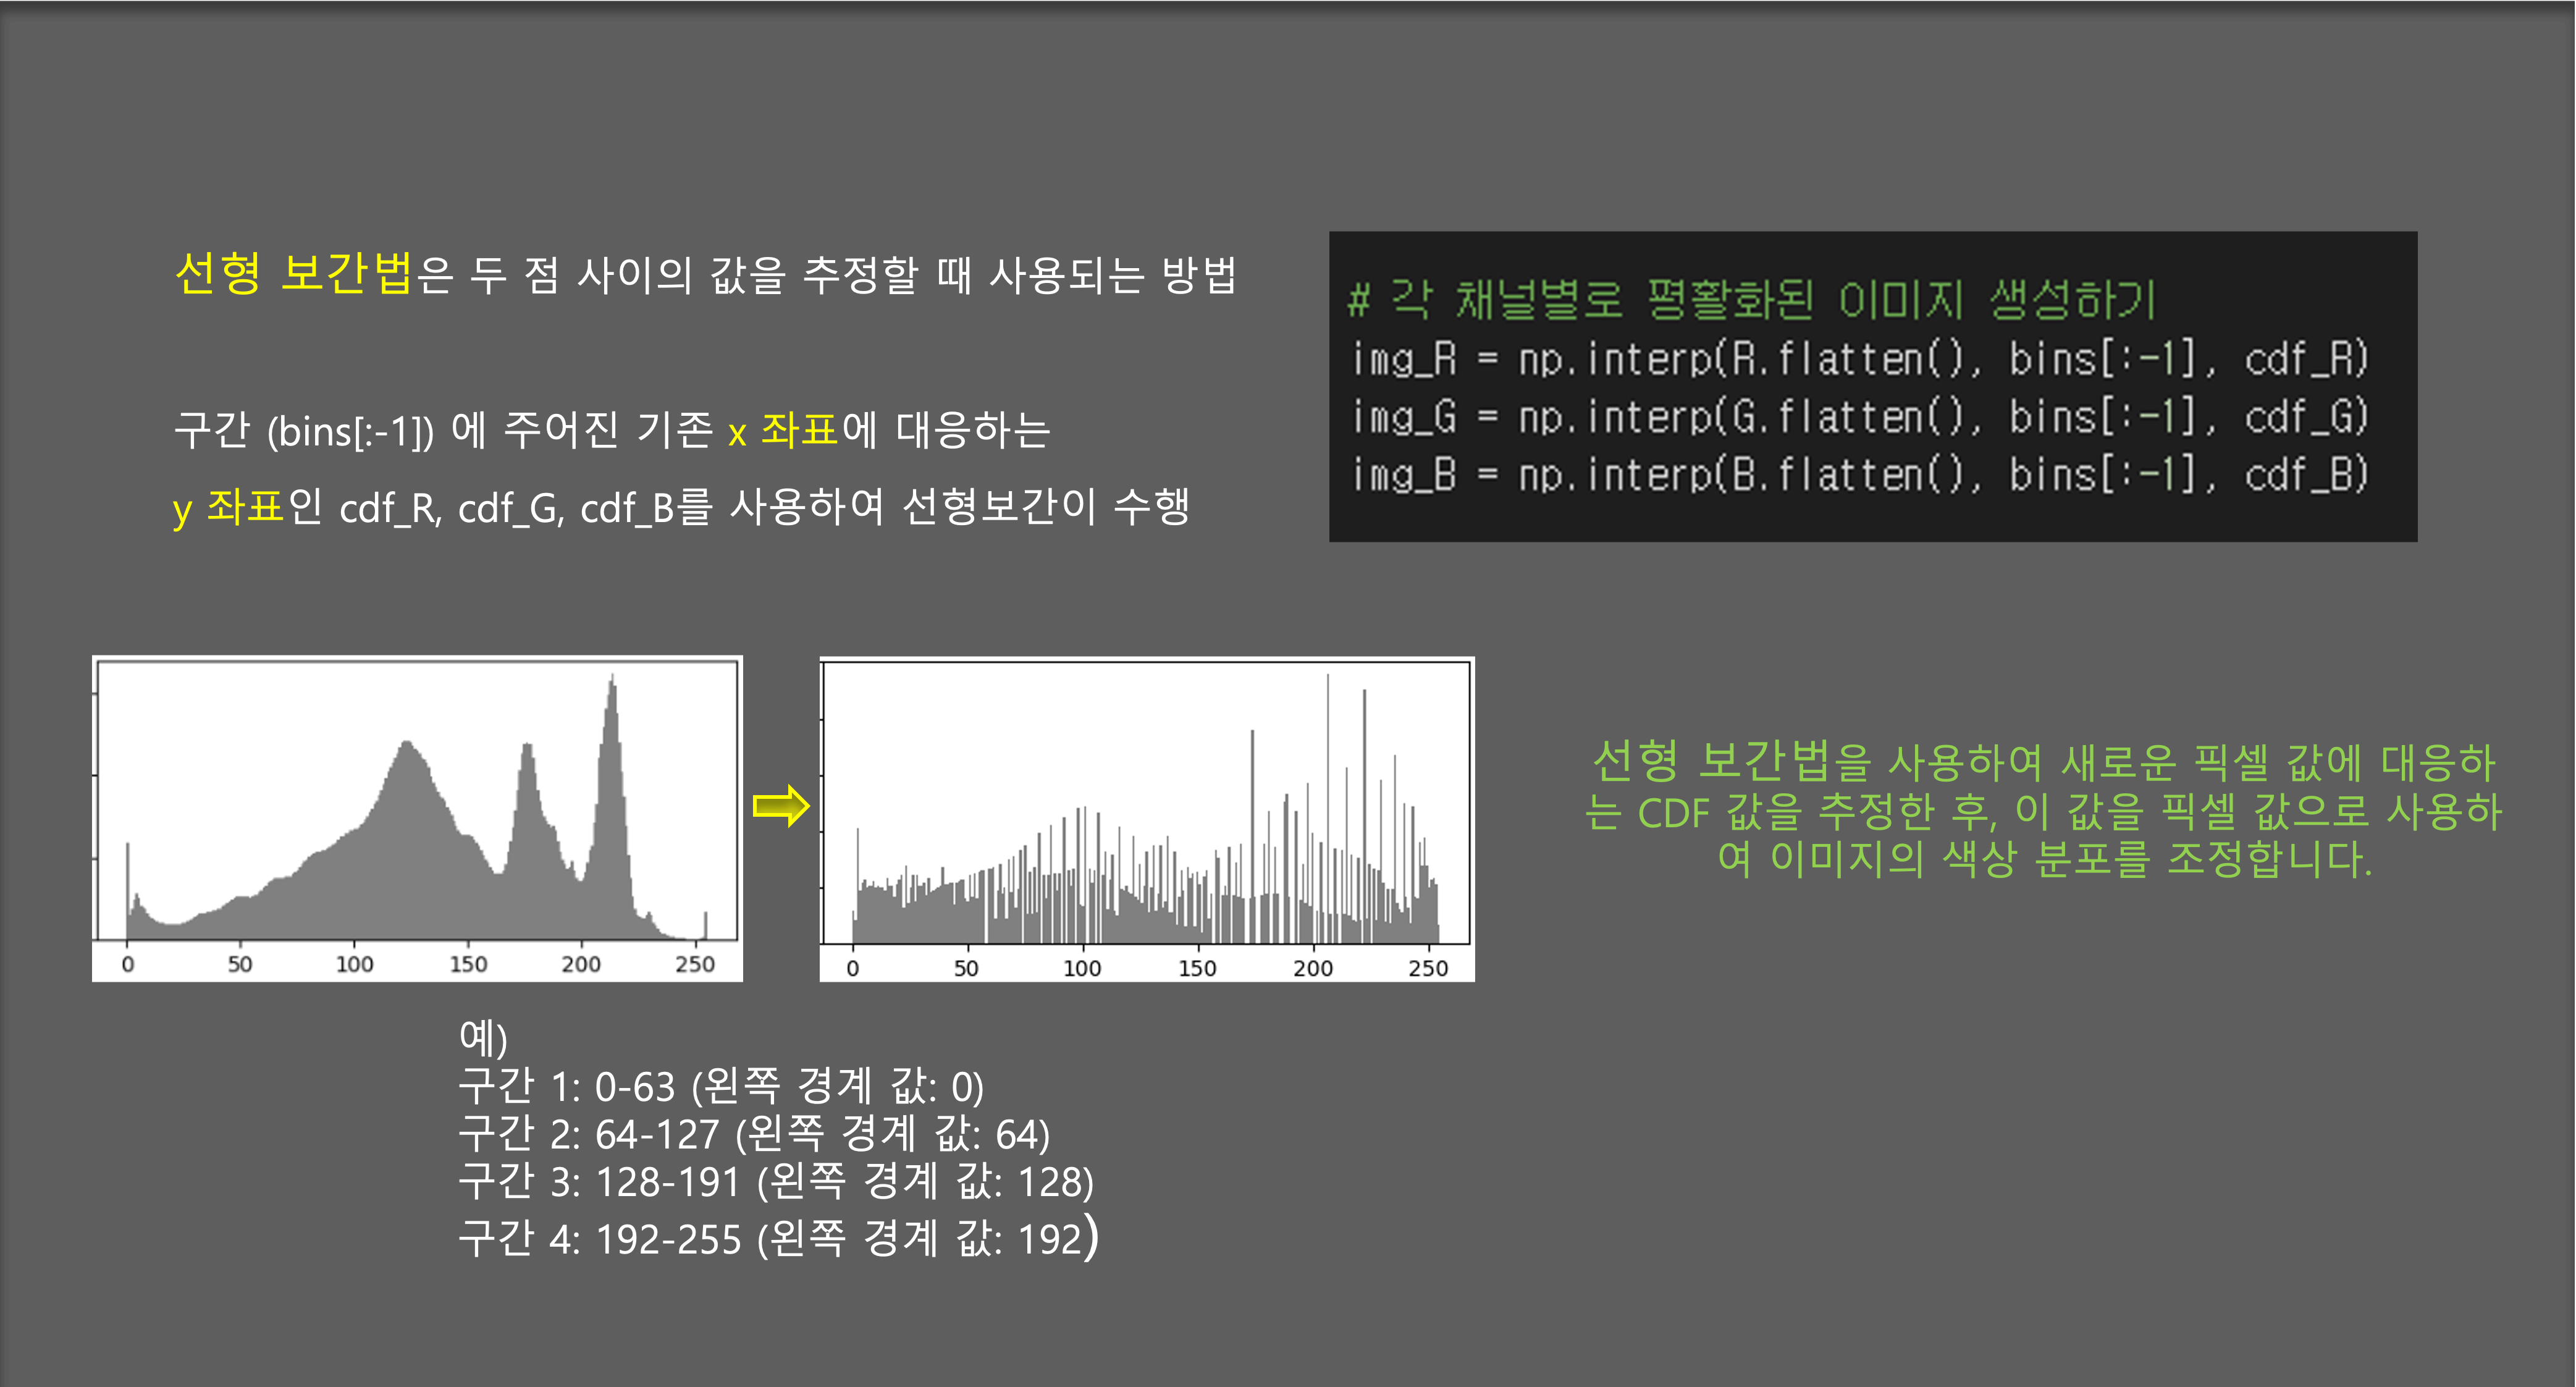
선형보간법을 사용한 이유
모든 픽셀의 히스토그램을 평활화 하는 작업을 위해 두 점 사이의 값을 추정하는 선형보간법을 사용

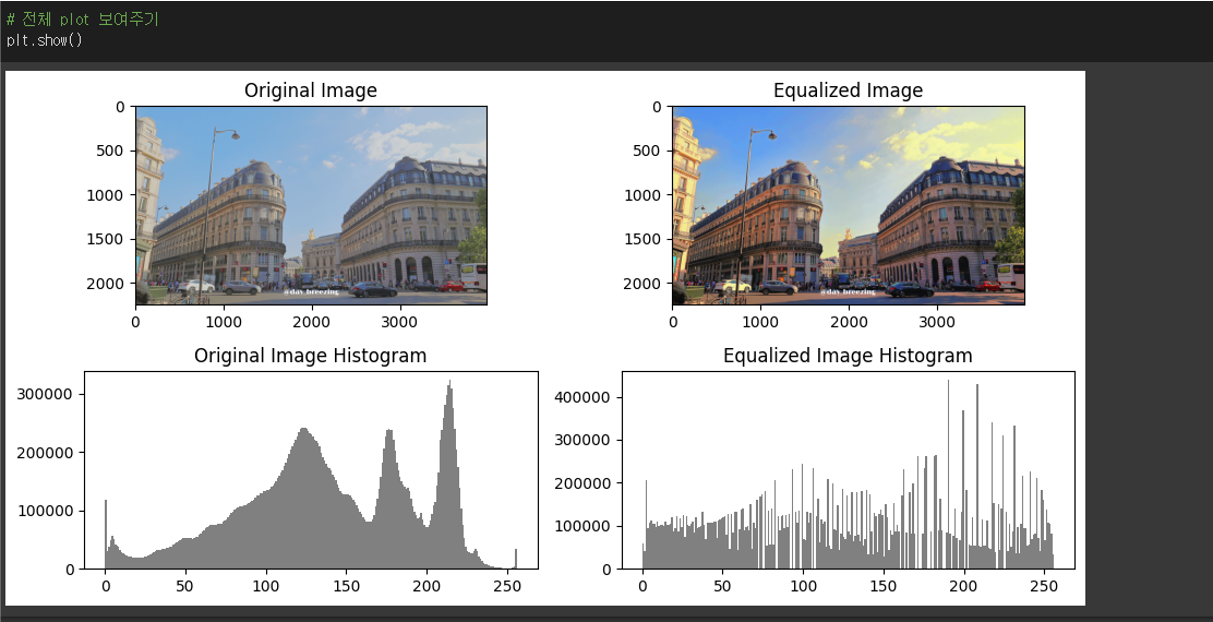
구현 결과

댓글남기기